conversableeconomist posted: " Total household wealth is equal to the value of assets, including both financial assets and housing, minus the value of debts. The Congressional Budget Office has just published "Trends in the Distribution of Family Wealth, 1989 to 2019" (September 2022)" Conversable Economist
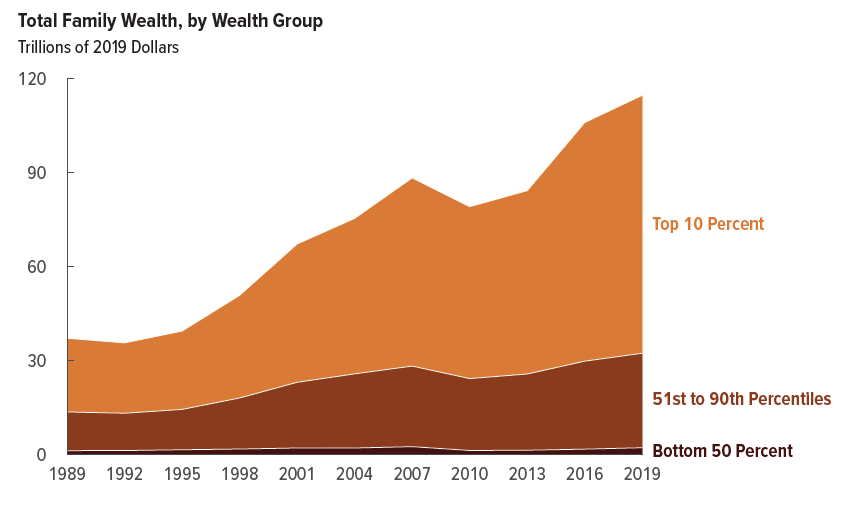
In 2019, total family wealth in the United States—that is, the sum of all families' assets minus their total debt—was $115 trillion. That amount is three times total real family wealth in 1989. Measured as a percentage of the nation's gross domestic product, total family wealth increased from about 380 percent to about 540 percent over the 30-year period from 1989 to 2019, CBO estimates. ... From 1989 to 2019, the total wealth held by families in the top 10 percent of the wealth distribution increased from $24.3 trillion to $82.4 trillion (or by 240 percent), the wealth held by families in the 51st to 90th percentiles increased from $12.7 trillion to $30.2 trillion (or by 137 percent), and the wealth held by families in the bottom half of the distribution increased from $1.4 trillion to $2.3 trillion (or by 65 percent).
Second, the growth in wealth has not been equal: households in the upper part of the wealth distribution now hold a greater share of wealth than in the past. The CBO points out that differences in wealth are correlated with many factors, like age, marriage, and education. But while these factors can help to explain differences in wealth at a point in time, it's not clear to me that changes in these factors can explain the growing inequality of wealth. Instead, my own sense is that the growing inequality of wealth is a version of a "Matthew effect," as economists sometimes say. In the New Testament, Matthew 13:12 reads (in the New King James version): "For whoever has, to him more will be given, and he will have abundance; but whoever does not have, even what he has will be taken away from him." In the context of wealth, those who were already somewhat invested in the stock market and in housing by, say, the mid-1990s have benefited from the asset boom in those areas; those who were not already invested in those areas had less chance for pre-existing wealth to grow.
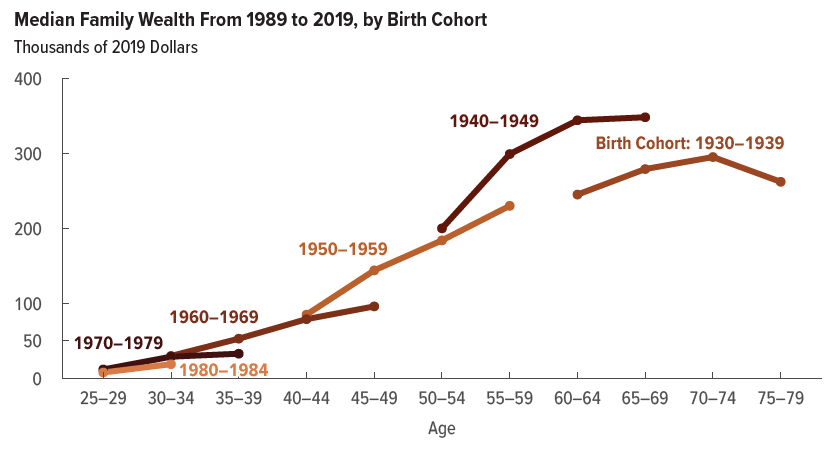
Finally, the pattern of wealth accumulation over the life cycle appears to be shifting. In this graph, notice that those born in the 1940s have substantially more wealth when they reach their 60s than does the previous generation of those born in the 1930s. However, the generation born in the 1950s is on a lower trajectory: that is, their median wealth in their late 50s is less than what has been accumulated by the generation born in the 1940s. As you work down to more recent generations, each line is below that for the previous generation: that is, each generation is accumulating less wealth than the previous generation did at the same age.
The CBO writes: However, for cohorts born since the 1950s, median wealth as a percentage of median income was lower than that measure was for the preceding cohort at the same age, and median debt as a percentage of median assets was higher."
The CBO report also offers some updated through the first quarter of 2022, at which time total wealth and the stock market were holding up pretty well through the pandemic recession. But since April, US stock markets are down about 20%., and the totals and distributions above would need to be adjusted accordingly..


No comments:
Post a Comment