Natural catastrophes pose a tremendous threat to our health and lives but are also a cause of huge losses in property and infrastructure. As the frequency and severity of calamities around the world increase, so does the interest in new financial instruments used as protection from potential catastrophe risks.
Catastrophe (CAT) bonds are insurance-linked securities created to transfer reinsurance risks from insurance and reinsurance companies to capital market investors. If a predefined natural catastrophe occurs, called a trigger, the issuer may use funds obtained from the bond sale to cover incurred losses. The potential loss of invested capital is compensated by high interest rates for investors.
The trigger is a crucial part of the CAT bond – it might be based on the direct losses of an insurance company, a financial index, or other parameters such as the magnitude of an earthquake. CAT bonds may rely on multiple triggers as well, for example losses caused by natural catastrophes in different regions or even countries. One of the goals of our research is to construct models of losses coming from two regions at once to properly price such instruments.
The first and simplest approach is to define a two-dimensional process $ latex S(t) = (S_1 (t), S_2 (t) $, where $ latex S(i),$ latex i=1,2$ describes the aggregate losses caused by natural catastrophes until time  in thei-th region. We can define it as:
$ latex S_1 (t) = sum_{k=1}^{N_1 (t)} X_k, $ $ latex S_2 (t) = sum_{k=1}^{N_2 (t)} Y_k$.
where $ latex N_i,$ $ latex i=1,2$ are counting process describing the number of catastrophic events occurring in i-th region, $ latex X_k$ and $ latex Y_k$ are random losses caused in the first and the second region, respectively.
Unfortunately, such an approach does not differentiate between losses coming from catastrophes affecting only one of the regions and potentially correlated losses from events affecting both at the same time. Thus, we propose a second model:
$ latex S_1 (t) = sum_{k=1}^{N_1 (t)} X_k^{(1)} + sum_{k=1}^{N_3 (t)} Y_k^{(1)}, $ $ latex S_2 (t) = sum_{k=1}^{N_2 (t)} X_k^{(2)} + sum_{k=1}^{N_3 (t)} Y_k^{(2)}$.
where $ latex S_1 (t) = sum_{k=1}^{N_i (t)} X_k^{(i)} $ is a sum of losses from catastrophes affecting only i-th region,  , and $ latex N_3 (t) $ counts catastrophes hitting both regions at a time, resulting in losses
  and
and  in the first and the second region, correlated with some coefficient
  .
.
In general, the price of a CAT bond is given as a discounted expected value of its payoff at the maturity of the bond. We define the payoff of a zero-coupon CAT bond for our models as follows. If at the maturity of the bond, the aggregate losses do not exceed threshold levels specified for each region, the investors receive the whole invested capital back. However, if the losses are higher than the given threshold in at least one of the regions, investors lose everything, since the issuer uses the money to cover the losses.
For illustration of our models, we use the PCS index – a series of estimates of losses caused by natural catastrophes in the USA. Analysed losses were caused by wind, thunderstorm, and winter storm events between 1985 and 2010, in two pairs of states – Oklahoma and Texas, Illinois and Kentucky. After calibrating both models to our data, we priced a two-year zero-coupon CAT bond using Monte Carlo simulations.
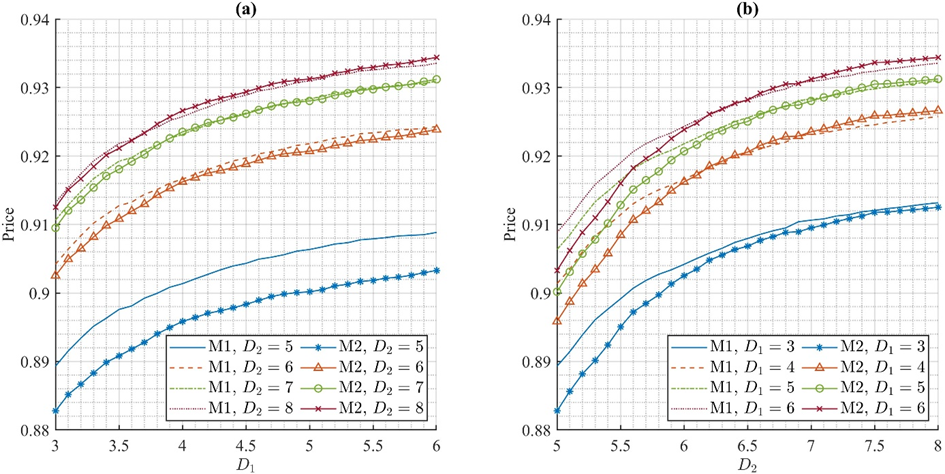
As we can see in Figures 1 and 2, the price of a CAT bond naturally increases with the threshold level D– the higher the threshold, the lower the probability of the aggregated losses exceeding it and, therefore, of the investors losing the invested capital. Including the correlation between losses from common catastrophes clearly affects the price. Especially for lower values of thresholds, not including the dependency between common losses might artificially increase the price of the bond by underestimating the risk of aggregate losses exceeding given level. For instruments such as the CAT bond, which payoff is contingent on the severity of losses caused by natural catastrophes, choosing the right method of modelling plays a huge role in their pricing.
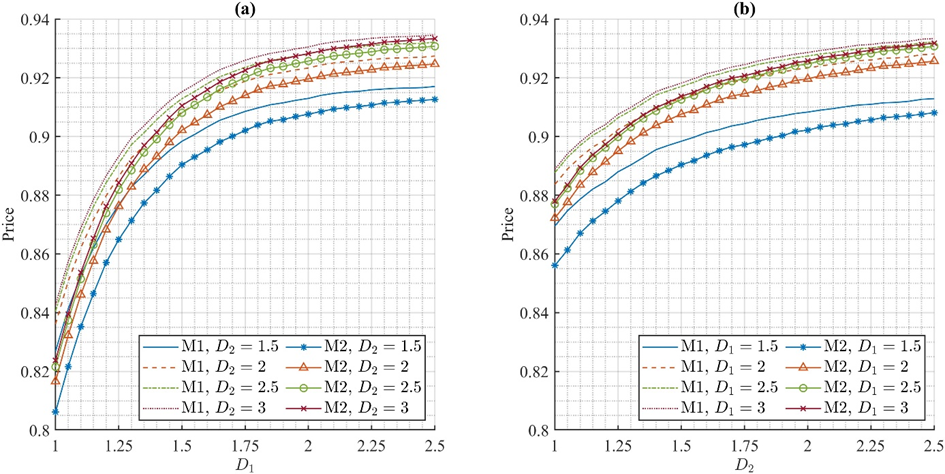
Figure 2: Two-region zero-coupon CAT bond prices for Illinois and Kentucky with no dependency between losses (Model 1 - lines without markers) and correlation between common losses (Model 2 - lines with markers) with (a) fixed threshold

for Kentucky, with respect to threshold

for Illinois, and (b) fixed
, with respect to $ latex D_2$.
By Martyna Zdeb (Wroclaw University of Science and Technology). The work supported by the NCN grant No. 2022/47/B/HS4/02139.


No comments:
Post a Comment