
Historical analysis and AI – what the spreadsheet tells us about AI and workAnd why the same story gets used to make contradictory predictions
I’m a keen reader of the many historical analogies that proliferate around AI. But there are so many of them, I keep discovering more, and I suspect it is beyond the ability of a single human to keep up with all of them. As a genre, it has exploded.
It is somewhat reminiscent of the sudden interest in the Great Depression after the 2008 Financial Crisis. But these were still the early years of social media, so many remained in the journalistic domain and were generally well-researched and based on long-form treatments (mostly academic, some journalistic). Kindleberger’s book on the history of financial crises got another outing. This time round is different because everyone suddenly writes historical analogies, frequently to promote their services or make a living on Substack, and the quality and transparency of their research are… well… mostly focused on producing a compelling story and argument. Narrative is narrative, right? Never mind that one is fictional, the other historical. Some serious academics make that argument. But I don’t buy it. And I think historical analogies are a great way to illustrate why they really aren’t. So, I am starting an occasional series on historical analogies and commentary on those that I encounter out in the wilds of social media. Full subscribers get the first read, and I’d love your comments and ideas. After two weeks, I’ll make them freely available and repost them on LinkedIn, because having historians weigh in on overused historical analogies might just be quite important and maybe a public service highlighting the value of the humanities and social sciences. Catch-up service:The AnalogiesThere are so many, and they are used to argue that we should be wary of the threats of AI as much as that we should be optimistic. Let’s start with the one I most enjoyed reading and researching recently… The spreadsheetDisclaimer – I love a good spreadsheet. The spreadsheet analogy is mostly used to reassure people about artificial intelligence and jobs. It goes like this: In 1979, a Harvard MBA student named Dan Bricklin grew tired of recalculating ledgers by hand and built the first electronic spreadsheet, VisiCalc. Within a few years, the spreadsheet had swallowed the work of the bookkeeper, the clerk who spent their days adding columns of figures. And yet the accounting profession did not collapse, but expanded. The machine took over the arithmetic, and the humans moved up to the interesting work. So, this analogy implies that AI will do the same for the rest of us. Great story, and the historical details are essentially correct. It provides succour to worried university graduates when white-collar automation comes up. Tim Harford wrote an entire 2024 essay about it under the title “What the birth of the spreadsheet teaches us about generative AI.” Many aspects make this an enticing analogy: the humdrum nature of the spreadsheet today makes it quaint and appealing to think about it as revolutionising everything. But having worked for years in a business school department of economists and economics-adjacent scholars, I found that one of my favourite colleagues, with whom I co-managed one of our main postgraduate courses, Kirit, had been at the university for ages. In the same office. Which would have made a historian proud: papers stacked everywhere, and the sedimentation layers were sometimes broken up to show stuff from the 80s. Kirit, of course, learned his trade late in the mid-century, running regressions by hand. He once mentioned that, and that he still had papers from this that he would never need again – because today it is all done on the computer (Stata more so than Excel). The technology storySo, it is a damn fine technology story. Don’t underestimate what the spreadsheet means, not just to the quants folk, but to anybody in a management position. Being a research director in the late teens, spreadsheets became central to my armoury. And I’m a qualitative researcher. The origin story is well-documented – sadly, nobody told or taught it to me when I was at Harvard Business School in 2007/08, which seems like a shocking oversight for the Business History group there. An MBA student called Dan Bricklin, class of 1978, was watching a professor erase and rewrite the interlocking figures of a financial model on the blackboard, or so the story goes. Bricklin imagined what he later called a word processor that worked with numbers. With another guy, Bob Frankston, he founded Software Arts and released VisiCalc for the Apple II at the end of 1979. It was the first “killer app”, software so useful that people bought the computer in order to run it. Mitch Kapor’s Lotus 1-2-3 (1983) overtook it on the IBM PC, and Microsoft Excel eventually won the market once the graphical interface arrived. Steven Levy captured the cultural moment early, in a 1984 essay for Harper’s that charted the emerging “spreadsheet way of knowledge”, a faith that the world could be captured in rows and columns. The article is great and well worth a read – evoking a period from an adult perspective that I remember only as a child. Charmingly, it also reproduces a simple screenshot of what a VisiCalc matrix actually looks like – because it was still an “out there” concept for many. 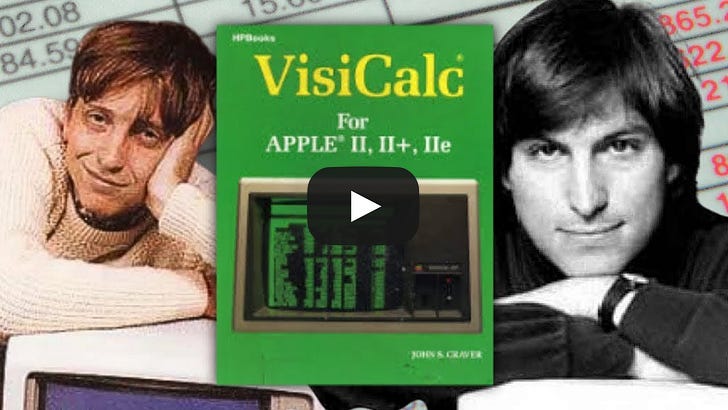
The VisiCalc (and wider spreadsheet) story is so appealing given what a moderate, non-revolutionary technology introduction it was. Nevertheless, employment numbers can be linked to it very clearly: since 1980, roughly the moment VisiCalc took off, around 400,000 jobs for bookkeepers and accounting clerks disappeared in the United States, while about 600,000 jobs for accountants were added. The numbers behind it come from a much-shared 2015 episode of NPR’s Planet Money on “Spreadsheets!”. Harford’s piece provides the bigger picture: the Bureau of Labor Statistics counted some 339,000 accountants and accounting clerks in 1980 and around 1.4 million accountants and auditors by 2022. The mechanism is the interesting thing, the much-belaboured Jevons Paradox: When something, in this case accounting, gets cheaper, businesses and consumers buy far more of it. Questions that were once too expensive to ask, the endless “what if we changed this assumption” scenarios, suddenly became trivial, so people asked many more of them. Cheaper analysis produced more demand for analysis, and the humans who could interpret it became more valuable rather than less.
The Jevons paradox, also known as complementarity in economics, highlights that demand increases as prices drop. David Autor reflected on this in the context of automation and why it had not, in the aggregate, eliminated human jobs so far. Automation may be substituting for some human tasks, but this can raise the value of the tasks it cannot do, and when demand for the product is elastic (i.e., you’d happily have more of it if you had enough money to afford it), then you will see a net growth in jobs. The related analogy is that of the bank teller: cash machines did not reduce the number of bank tellers; their roles just shifted towards more human interaction and advice, and less tallying and reconciling of accounts. So, ATMs reduced the cost of running a branch, banks opened more branches, and for a couple of decades, teller numbers rose rather than fell. Fear not, spreadsheets and bank tellers give hopeThe function of any one of these analogies is not to tell the history but to end with the moral of the story, like in Grimm’s fairy tales. So, it is worthwhile watching for the sleight of hand of the analogy magician when they present you with the history.
The Value of AnalogiesSo: same history – different lessons. It’s almost as if Sting was right that history will teach us nothing. But not so fast. Analogies seek to extrapolate a mechanism for which a history is sought, and that choice was made before the history was consulted, not after. Basically, an argument by historical analogy is rarely built on the analogy itself; rather, the analogy is chosen to illustrate the outcome. Fitting data post hoc is rarely a good approach, and analogies built on this logic only work as long as the audience does not actually know the history referenced. Analogies illustrate mechanisms – claims about why something happened, not whether that mechanism fits the present. The reassuring spreadsheet story rests on the Jevons Paradox, which in turn requires demand for the product or service to be elastic: if something becomes cheaper, you want more of it. If food becomes cheaper, there is a limit to how much more food you are going to consume. If software becomes cheaper, will you be buying more software? 
In a recent piece in the Financial Times, Carl Benedict Frey made the point that this does not apply to all types of technological innovation. The washing machine, another modest technology, made laundry cheaper for households. Instead of consuming more laundry services, households absorbed the work as society moved further towards a self-service economy (a pattern identified by the sociologist Jonathan Gershuny in 1978). With this, an economically value-added sector vanishes from sight in any economic analysis. So, what is the right analogy for AI? Washing machines or spreadsheets? That is the wrong question. Neither explains in isolation what was happening at the time, because historical analysis, in contrast to many historical analogies, is multi-causal: more than one mechanism operates at any one time; they all interact, and, like sound waves, either amplify each other or cancel each other out. Take Oks’s claim that the spreadsheet was the cause of the dealmaking frenzy of the 1980s. Other significant mechanisms in play were the availability of cheap credit and undervalued equities: you could buy a company for less than the worth of its parts and finance the purchase with cheap borrowed money. Alongside this, the “junk” bond market created access to easy finance. The combination of these factors (alongside political, tax-related, and ideological changes), rather than any spreadsheet acrobatics, is what made the arithmetic of the leveraged buyout work. Having computers running spreadsheets made this more obvious and easier to scenario-plan, but the macroeconomic conditions and financial innovations that created the opportunities were the more fundamental ingredients. Without it, the spreadsheets could not have pointed the path to profit. Drawing analogies between past dynamics of technology and work isn’t always (nay, rarely) based on an understanding of historical complexities – rather, they are assembled as illustrations of mechanisms that their authors believe are at play now. They are easy to spot because the nature of their argument is fundamentally different from that of historical explanations: historical analogies normally posit and extrapolate a single causal mechanism. Historical explanations are almost always multi-causal and complex. Because life and technological change in the past felt equally crazy, unpredictable and threatening – much like today. References
You're currently a free subscriber to History in Organizations. For the full experience, upgrade your subscription.
|






No comments:
Post a Comment